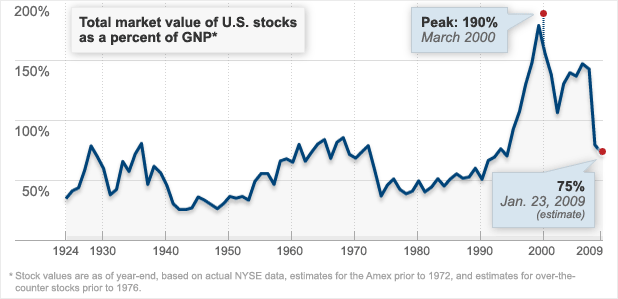
...Fortune first ran a version of this chart in late 2001 (see "Warren Buffett on the stock market"). Stocks had by that time retreated sharply from the manic levels of the Internet bubble. But they were still very high, with stock values at 133% of GNP. That level certainly did not suggest to Buffett that it was time to buy stocks.See the complete article here.But he visualized a moment when purchases might make sense, saying, "If the percentage relationship falls to the 70% to 80% area, buying stocks is likely to work very well for you."...
2 comments:
What are your thoughts on the criticism that the previous Buffett market calls were when his metric was far lower?
http://valueplays.blogspot.com/2009/02/buffett-metric-does-not-say-it-is-time.html
I believe an important factor to keep in mind is opportunity cost. In the 1970's, the rate of return on a 10 year treasury ranged between 6 and 9%. A 10-year today offers 2.64%. Granted, inflation jumped between 3 and 12%. But an investment in treasuries today shows little faith in the ability of the U.S. government to create stability and maintain positive inflation.
Buffett, with his focus on high quality companies, probably sees today as an opportunity for either 2.6% risk free treasuries for 10 years, or 5-7% earnings yields of high quality companies which will likely grow that figure over the next 10 years.
Post a Comment